Kibana is an open-source tool used to visualize the data stored in Elasticsearch. It can generate pie charts, histograms, line graphs, etc for data visualization. We can also use the Elastic Maps with Kibana to visualize the location-based data. Another usage of Kibana is to analyze time-series. We can also visualize and analyze the Graphs and Networks using it.
This tutorial provides all the steps required to install Kibana on Windows and getting familiar with it using the sample data. We will also configure it as Windows Service using PowerShell. It assumes that Java is already installed on the system and Elasticsearch is either installed on the system or accessible to the system. You may follow How To Install Java 13 On Windows, How To Install OpenJDK 13 On Windows and How To Install Java 11 On Windows to install Java. You can also follow the tutorial How To Install ELK Or Elastic Stack (Elasticsearch, Kibana, Logstash, and Winlogbeat) on Windows to get an overview of the Elastic Stack and to install Elasticsearch on Windows.
Download Kibana
Open the Download Link to start downloading Elasticsearch, Logstash, and Kibana. The download page provides options to download Kibana as shown in Fig 1.
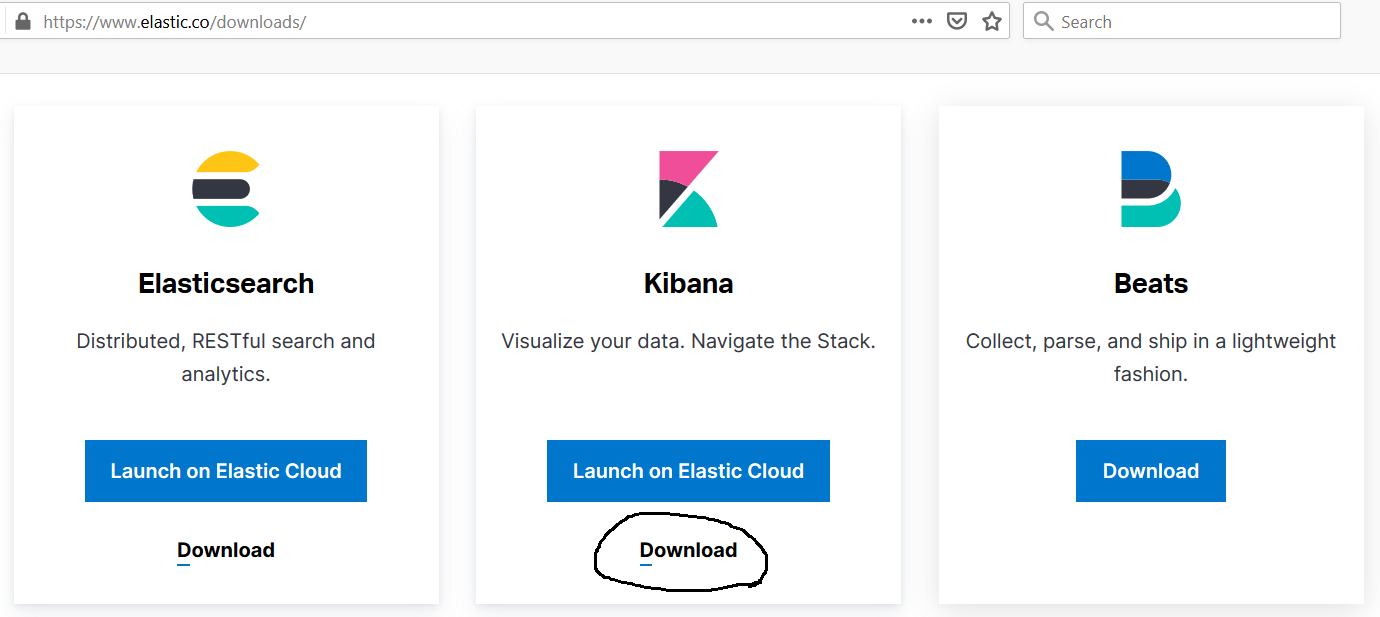
Fig 1
Click the Download Button as highlighted in Fig 1. It will show the download options for Kibana as shown in Fig 2.

Fig 2
Now download Kibana for Windows as highlighted in Fig 2.
Install Kibana
In this step, we will install the Kibana on Windows using the zip downloaded by us in the first step. Extract the zip at your preferred location and navigate to the bin directory of the installation as highlighted in Fig 3.

Fig 3
Make sure that Elasticsearch is already running on the system. We can also configure Kibana to access Elasticsearch running on a different system by updating its configuration i.e. elasticsearch.hosts. You will also be required to purchase the appropriate license to use X-Pack to securely access Elasticsearch in case it is running on a different machine(on a public network) than Kibana. Now start Kibana using the console as shown in Fig 4 and Fig 5.

Fig 4
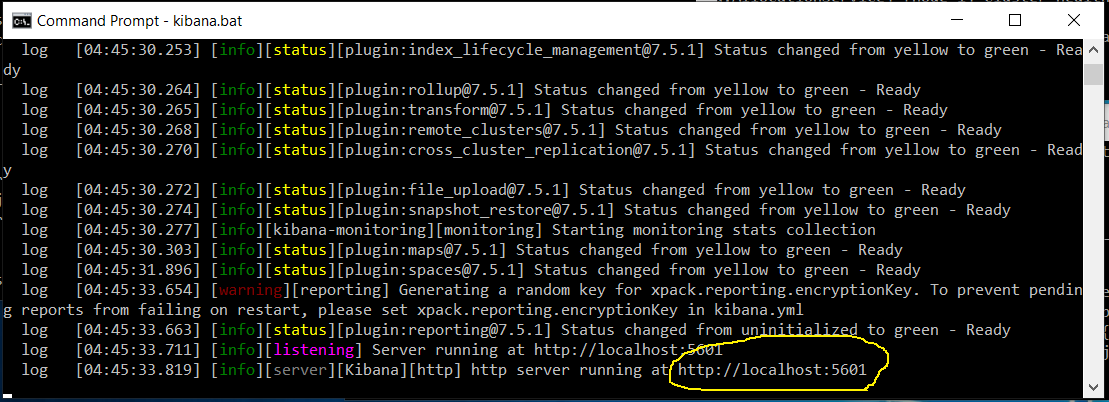
Fig 5
By default, Kibana listens on port 5601. Now open the Kibana in the Browser using the URL http://localhost:5601. The default dashboard looks like the one in Fig 6.

Fig 6
We can stop Kibana by pressing Ctrl + C.
Now click on the top left icon as highlighted in Fig 6 to load some sample data. It will show sample data options as shown in Fig 7 and Fig 8.

Fig 7
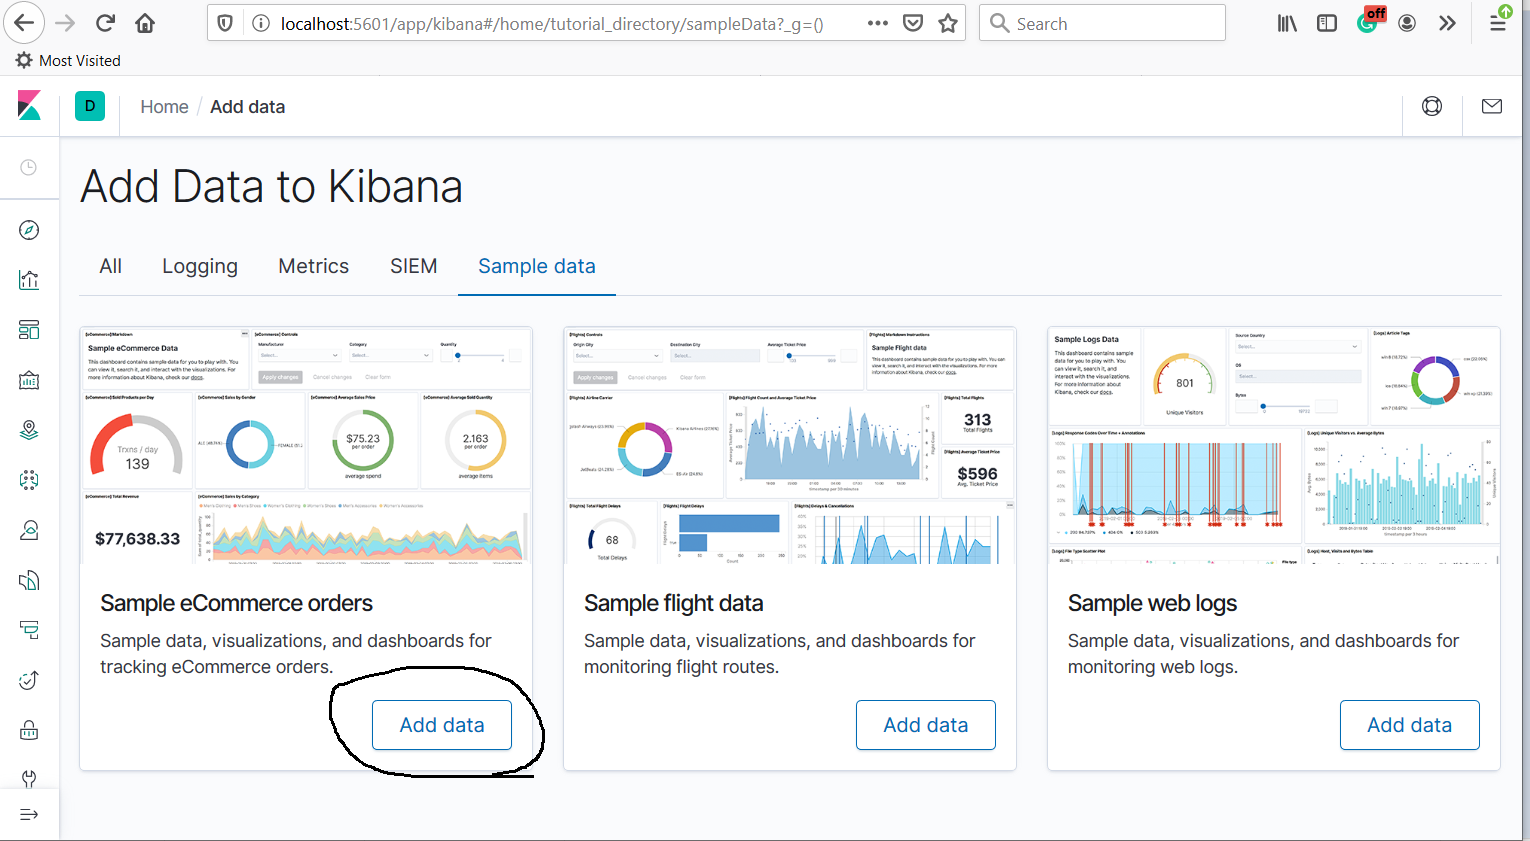
Fig 8
Click the Add Data Button to start adding the sample data. After adding the data, it will show options to view the data as highlighted in Fig 9.

Fig 9
Click the View Data Button and choose Dashboard. It will load the dashboard of the Ecommerce sample data as shown in Fig 10.
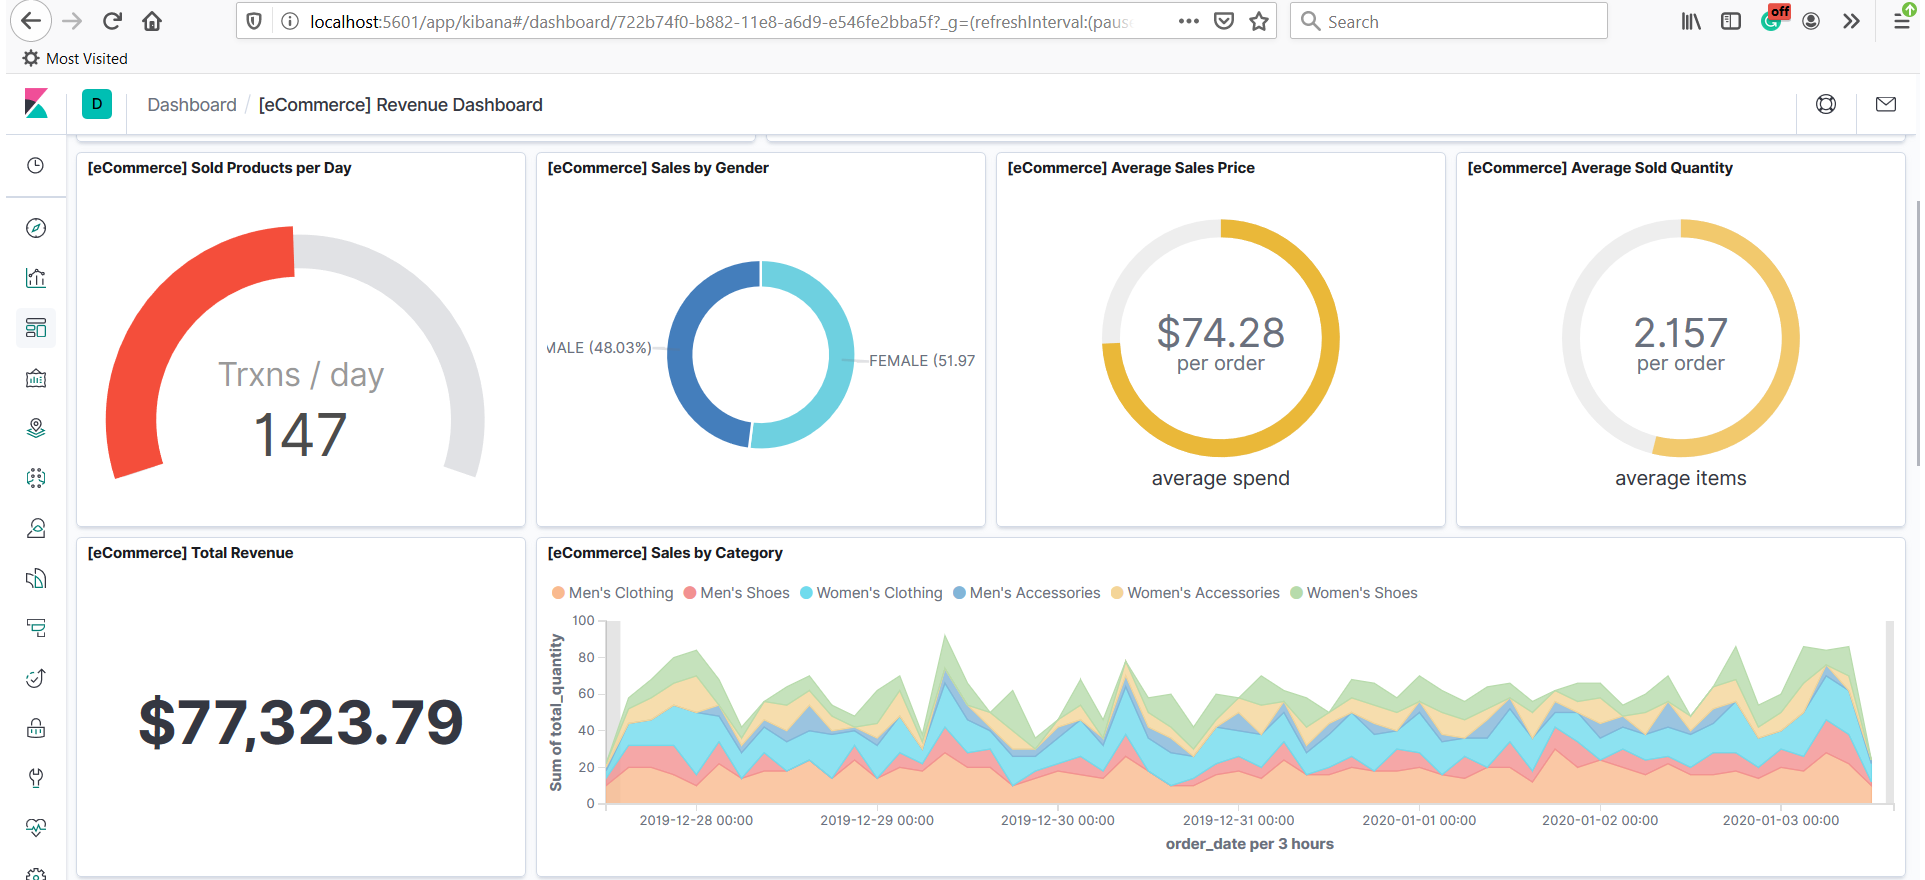
Fig 10
We can further analyze the sample data to learn more about the Visualizations used in the eCommerce. You may also analyze the sample data index as shown in Fig 11.

Fig 11
This is all about installing Kibana and getting familiar with it using the sample data.
Configure Windows Service Using NSSM and PowerShell
We can configure Kibana as Windows Service to start on system startup. This will make sure that Kibana is always running on the system. Also, make sure that it always finds an active Elasticsearch service else it won't work in the absence of Elasticsearch.
Download NSSM - Download the NSSM (Non-Sucking Service Manager) and extract it at your preferred location.
Start PowerShell - Now search for PowerShell using the Cortana and run it as Administrator as shown in Fig 12. It will also ask for system permissions. Allow PowerShell to run as Administrator.

Fig 12
Install Windows Service - Navigate to the NSSM directory and use the nssm command to start installing Kibana as Windows Service as shown in Fig 13.

Fig 13
Now configure the service as shown in Fig 14.

Fig 14
Click the Install Service Button to install the service. It will show the success message as shown in Fig 15.

Fig 15
Verify Windows Service - Now open the Task Manager to verify whether the service is installed. It will show the Service with status stopped as shown in Fig 16.
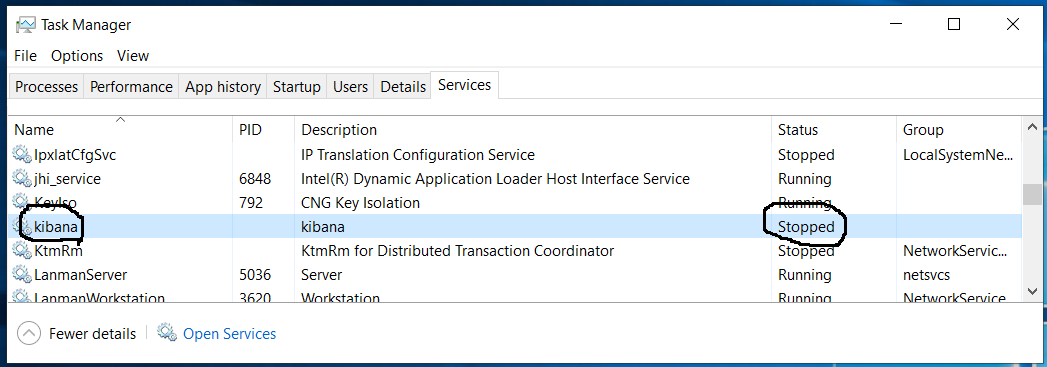
Fig 16
We can start or stop the service either from the Tasks Manager or PowerShell. It can be started using the Task Manager by right click -> start as shown in Fig 17.
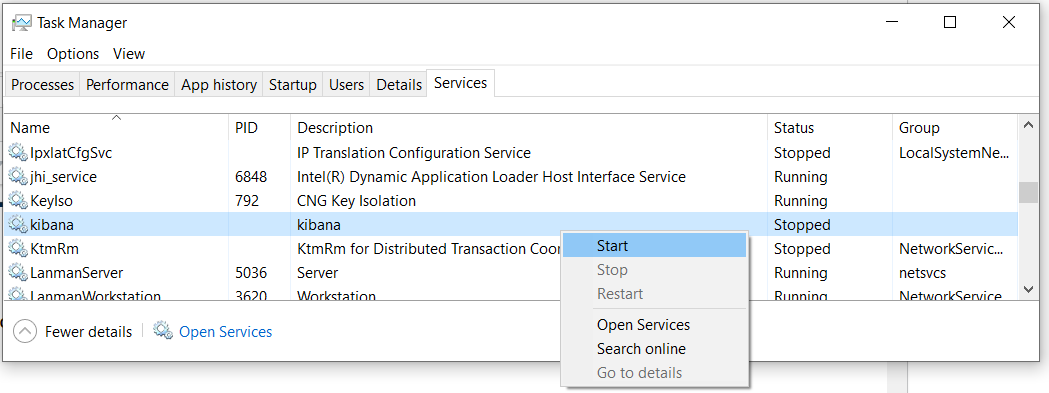
Fig 17
The status will be changed from Stopped to Running. Now we can access Kibana from the Browser.
Summary
This tutorial provided the steps required to install Kibana and getting familiar with it by using the test data. It also explained the steps required to configure Kibana as Windows Service using NSSM and PowerShell.

