Elasticsearch is among the most popular search engines and it's based on the Apache Lucene library. It's a distributed search engine and provides options to perform RESTful searching. Elasticsearch can also be used as an analytics engine when installed together with Logstash and Kibana. The popular uses of Elasticsearch include Searching, Monitoring, Business Intelligence, and Web Analytics.
Official Definition of Elasticsearch - Elasticsearch is a distributed, RESTful search and analytics engine capable of addressing a growing number of use cases.
Elasticsearch, when installed together with Logstash and Kibana, is called ELK Stack. Logstash ingests or collects data from multiple sources simultaneously and transforms or parse the data by following the pre-defined rules to store it in Elasticsearch. Kibana is an advanced visualization tool to visualize the data stored in Elasticsearch using charts and graphs. We can use Kibana to search and visualize the logs indexed by Logstash.
Official Definition of Beats - Beats is the platform for single-purpose data shippers. They send data from hundreds or thousands of machines and systems to Logstash or Elasticsearch.
Filebeat can be used to send the logs and files to the ELK Stack to process, index, and visualize. Similar to Filebeat, the remaining from the Beats family includes Metricbeat, Packetbeat, Winlogbeat, Auditbeat, Heartbeat, Functionbeat. The ELK Stack with Beats is called Elastic Stack.
Logstash example: The Logstash can directly consume the logs sent by Filebeat installed on the other systems to collectively parse the logs and files from multiple sources to be indexed in Elasticsearch and analyzed by using Kibana. The data flow involved in the ELK Stack using Filebeat is shown in Fig ELK Flow.

ELK Stack
In this way, we can use Elastic Stack to perform Aggregation, Processing, Storage, and Analysis on the logs generated by multiple systems at a central system using Elasticsearch, Logstash, Kibana, and Filebeat.
This tutorial provides complete steps to install ELK or Elastic Stack including Elasticsearch 7.5, Logstash 7.5, Kibana 7.5, and Winlogbeat 7.5 on Windows 10. The steps should be the same for the other versions of Windows.
Notes:
- It assumes that Java is already installed on the system. You may also be interested in How To Install Java 13 On Windows, How To Install OpenJDK 13 On Windows and How To Install Java 11 On Windows. Since Elasticsearch 7.0, it ships with bundled Java, though we can configure it to use the Java installed on the system.
- You must install the same version of Elasticsearch, Logstash, Kibana, and Beats. While writing the tutorial, I have installed the most recent version i.e. 7.5.1.
- Also, make sure that you have at least 4 GB of RAM on your system.
Download Elasticsearch, Logstash, Kibana, and Winlogbeat
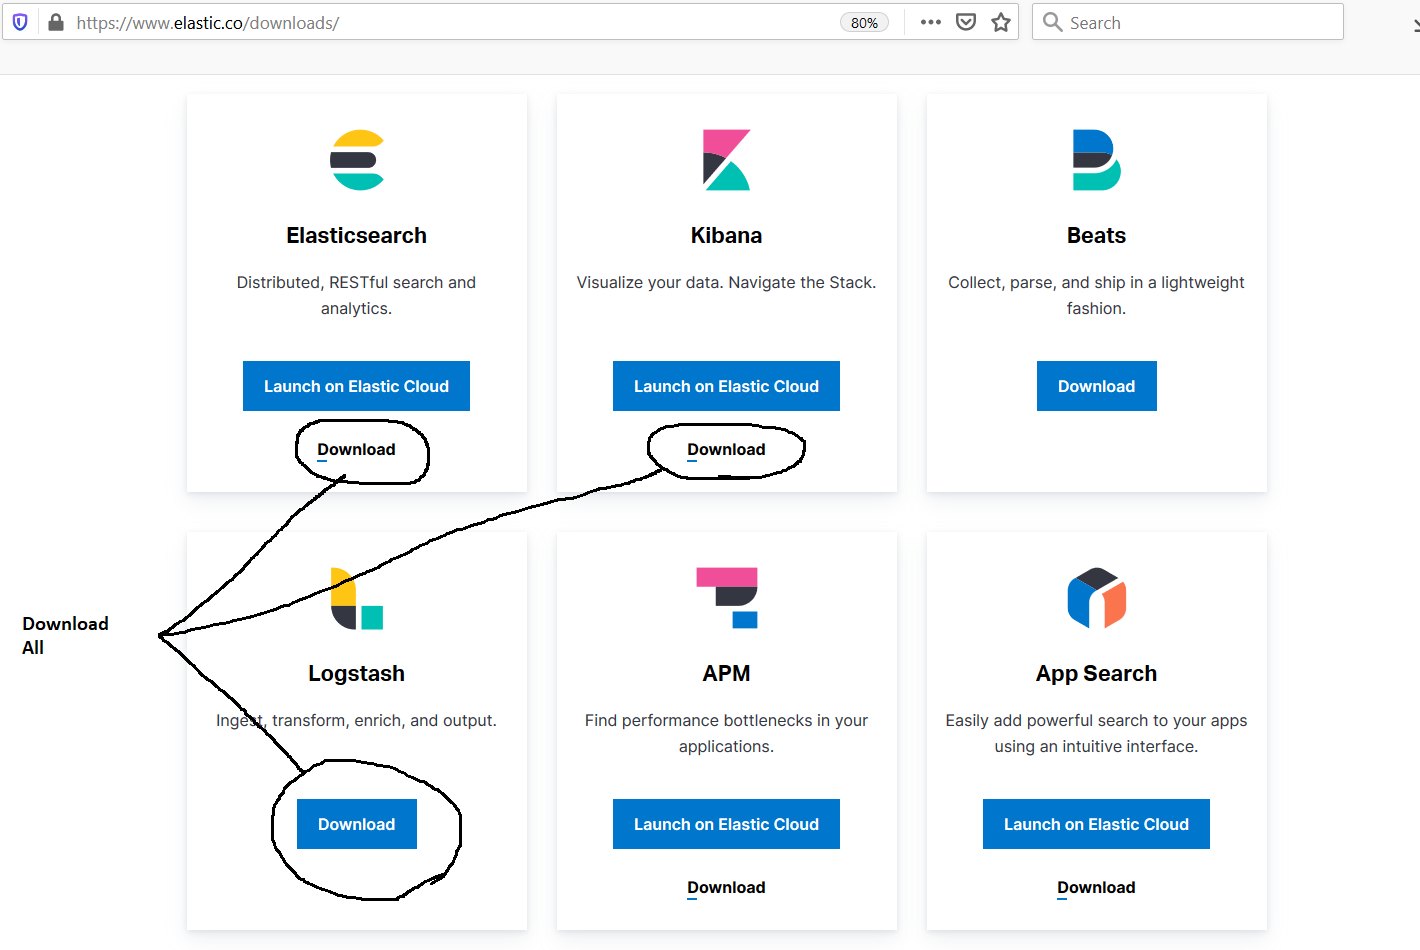
Open the Download Link to start downloading Elasticsearch, Logstash, and Kibana. The download page provides options to download all the Elastic Products as shown in Fig 1.

Fig 1
Click the Download Buttons as highlighted in Fig 1. These will lead to the product download pages as shown in Fig 2.

Fig 2
Download Kibana for Windows as highlighted in Fig 2. The Logstash does not show options for operating systems as shown in Fig 3. We can simply download the zip file as highlighted in Fig 3.

Fig 3
Also, download Winlogbeat as highlighted in Fig 4.

Fig 4
Install Elasticsearch
In this step, we will install the Elasticsearch on Windows using the zip downloaded by us in the previous step. It can also be installed using the MSI package installer on Windows. Extract the zip at your desired location and navigate to the bin directory of the installation as highlighted in Fig 5.

Fig 5
Now start the Elastisearch Cluster by executing the elasticsearch.bat as shown in Fig 6. I have also specified the cluster name and node name as shown in the below-mentioned command. We can also modify the <path to es installation>/config/elasticsearch.yml to permanently store the cluster name.
# Start Elasticsearch Cluster On Console
elasticsearch.bat -Ecluster.name=escluster -Enode.name=node-1

Fig 6
If Elasticsearch starts successfully, it will create the cluster and node-1 starts to listen to the port 9300 as a master node for node discovery. We can also access the cluster on port 9200 as highlighted in Fig 7.

Fig 7
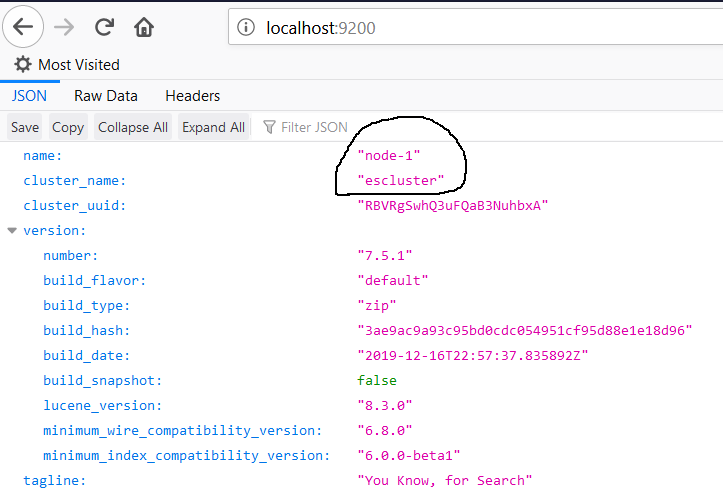
Now open the browser and navigate to http://localhost:9200/ to verify the cluster node. It should show the node status as shown in Fig 8.

Fig 8
Though we can work with a single node of the Elasticsearch, it's preferred to have at least 3 nodes to form the starting cluster for better stability and reliability. Now start two more nodes using the commands as shown below. Make sure that your system got sufficient free memory to accommodate two more nodes without hanging. Since we are starting the new nodes on the same system, these will automatically join the first node as shown in Fig 9.
# Start 2nd Node using another console
elasticsearch.bat -Ecluster.name=escluster -Enode.name=node-2 -Epath.data=data2 -Epath.logs=log2

# Start 3rd Node using 3rd console
elasticsearch.bat -Ecluster.name=escluster -Enode.name=node-3 -Epath.data=data3 -Epath.logs=log3

Fig 9
Also, note that the master node i.e. node-1 first join the node-2 and node-3 and then mark them as added to the cluster. The node-2 also add node-3 to its list.
This is how we can form our first cluster having 3 nodes of Elasticsearch. The other two nodes listen on the ports 9301 and 9302 for network discovery as highlighted in Fig 9. The ports 9300, 9301, 9302 will be used for network discovery, whereas 9200, 9201, and 9202 will be used to access nodes for REST requests. We can directly start interacting with the cluster by submitting the REST requests to create the Mappings and Documents and to query the documents.
We can also check the cluster health using the cat health API as shown in Fig 10. It will show the status as yellow in case we use only one node. The status yellow means that there is a risk of losing data.

Fig 10
We can stop Elasticsearch nodes by pressing Ctrl + C.
We can also install Elasticsearch as a Service on Windows to run in the background or start automatically on system boot using the bin/elasticsearch-service.bat file. We can use the below-listed commands using this executable file to install or remove Elasticsearch as a Windows service.
install - Install Elasticsearch as a Windows service.
remove - Remove the installed Elasticsearch service. It also stops the service if it's running.
start - Start the Elasticsearch service if installed.
stop - Stop the Elasticsearch service if it's running.
manager - Start a GUI to manage the installed service.
Install Logstash
In this step, we will install the Logstash on Windows using the zip downloaded by us in the first step. Extract the zip at your desired location and navigate to the bin directory of the installation as highlighted in Fig 11.

Fig 11
Now prepare the Logstash config file using the logstash command as shown in Fig 12.

Fig 12
We can test the Logstash installation using the most basic Logstash pipeline using the command as shown below.
# Logstash Bin On Console
logstash.bat -e "input { stdin { } } output { stdout {} }"
Logstash will take the input from the console and print back the same on the console using this basic pipeline as shown in Fig 13.

Fig 13
Note that the Logstash API point is on port 9600. This port can be used by the Beats to provide inputs to Logstash for further processing. This is the most basic usage of Logstash using the minimalistic pipeline.
Similar to Elasticsearch nodes, we can stop Logstash by pressing Ctrl + C.
Install Kibana
In this step, we will install the Kibana on Windows using the zip downloaded by us in the first step. Extract the zip at your desired location and navigate to the bin directory of the installation as highlighted in Fig 14.

Fig 14
Now start Kibana using the console as shown in Fig 15 and Fig 15.

Fig 15

Fig 16
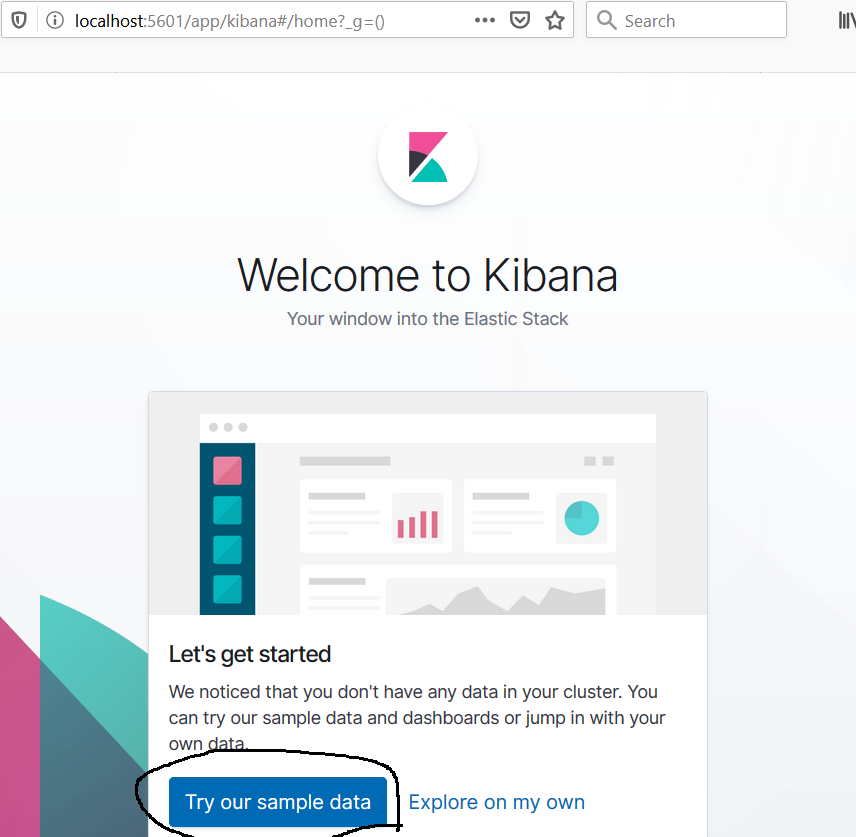
By default, Kibana listens on port 5601. Now open the Kibana in the Browser using the URL http://localhost:5601. The default dashboard looks like the one in Fig 17.

Fig 17
Similar to Elasticsearch nodes and Logstash, we can stop Kibana by pressing Ctrl + C.
Now click on the top left icon as highlighted in Fig 17 to load some sample data. It will show sample data options as shown in Fig 18 and Fig 19.

Fig 18

Fig 19
Click the Add Data Button to start adding the sample data. After adding the data, it will show options to view the data as highlighted in Fig 20.

Fig 20
Click the View Data Button and choose Dashboard. It will load the dashboard of the Ecommerce sample data as shown in Fig 21.

Fig 21
We can further analyze the sample data to learn more about the Visualizations used in the eCommerce. You may also analyze the sample data index as shown in Fig 22.

Fig 22
This is all about installing Kibana. It's a solid and robust tool to visualize and analyze the data.
Install Winlogbeat
In this step, we will continue with our installation of Elastic Stack and install Winlogbeat from the Beats family. In this step, we will install the Winlogbeat on Windows using the zip downloaded by us in the first step. Extract the zip at your desired location and navigate to the installation directory as highlighted in Fig 23.

Fig 23
We need to edit the winlogbeat.yml configuration file as highlighted in Fig 23 to configure Winloagbeat. The default configuration of the Winlogbeat is shown below. It's pre-configured for event logs, Kibana, and Elasticsearch. By default, Winlogbeat is set to monitor application, security, and system logs as shown below. Also, note that it's disabled for Logstash and enabled for Elasticsearch by default, which means that it will directly send the logs to Elasticsearch.
...
...
winlogbeat.event_logs:
  - name: Application
    ignore_older: 72h

  - name: System

  - name: Security
    processors:
      - script:
          lang: javascript
          id: security
          file: ${path.home}/module/security/config/winlogbeat-security.js

  - name: Microsoft-Windows-Sysmon/Operational
    processors:
      - script:
          lang: javascript
          id: sysmon
          file: ${path.home}/module/sysmon/config/winlogbeat-sysmon.js
...
...

setup.kibana:
...
...

output.elasticsearch:
  # Array of hosts to connect to.
  hosts: ["localhost:9200"]
....
....
Now test the configuration before starting Winlogbeat using the command as shown below.
# Test Winlogbeat Configuration
winlogbeat.exe test config -c winlogbeat.yml -e
It should pass the configuration test as shown in Fig 24.

Fig 24
This tutorial does not provide steps to configure Winlogbeat with Logstash to keep it simple. It also assumes that the winlogbeat.yml is not modified since the default configuration will load the default index template after successfully connecting to Elasticsearch. Setup the Kibana Dashboards using the command as shown below. Make sure that Kibana is running before executing this command.

Setup Kibana Dashboard
Now start Winlogbeat to start logging directly on Elasticsearch without Logstash as shown in Fig 25.

Fig 25
We can analyze the Winloagbeat Index and view the dashboard as shown in Fig 26 and Fig 27.

Fig 26

Fig 27
The dashboard will start showing the events as shown in Fig 28.

Fig 28
Similarly, we can run the Winloagbeat on multiple systems to collect the logs at a central location.
Advanced Setup
The previous sections explain about installing Elastic Stack on Windows 10. I have installed the Elasticsearch cluster with three nodes, Logstash, Kibana, and Winlogbeat on the same system which is good enough for learning purposes. The actual scenario will be different for the production environment based on your exact needs. You might install Winlogbeat on multiple systems and collect the stats at a central system for analysis purposes. You may also use Filebeats to analyze the log files. There are several use cases where we can use Elastic Stack and it will help in making our life simple which otherwise could be time-consuming to manually do these activities.
Summary
This tutorial provided all the steps required to install Elastic Stack on Windows 10 and also provided the steps to create an Elasticsearch Cluster of three nodes. It also explained about loading the sample data to Kibana to further learn it using the mapping and visualizations available with the sample data.

